In certain situations, the linear regression model isn't appropriate. You may find yourself in a situation where the predicted values are probabilities and thus must always be between zero and one. A linear regression assumes no such restriction. A logistic regression does.
The best way to explain logistic regression analysis may be with an example. Say we are interested in modelling the probability of a newborn having a birth defect given a mother's age. One could survey a number of mothers at various ages (X in our table), counting both those with normal births (coded as 0 in our table) and those with abnormal ones (coded as 1 in our table).
After collecting some data, it is time to run the logistic regression. To do this you need the total of all observations (both normal and abnormal births), the probability of observing some phenomenon (a birth defect in our case), the odds of occurence (infants with birth defects over those born normally), and the natural logarithm of the calculated odds.
A weighted linear regression is then produced using the total number of observations in each category (again, both normal births and those with defects per age) as weights. This linear regression is created with X (age) as the independent variable and the observed logarithm of the calculated odds. Again, using the total number of observations in each X (age) as weights.
This weighted linear regression produces an equation of the form ln(odds) = intercept + slope * X. (i.e., we regressed the Xs with the logarithm of the calculated odds). If we take both sides to be the exponent of e, we get odds = eintercept + slope * X. The probability of observing our phenomenon (again, a birth with a defect in this case) is then equal to odds / (1 + odds).
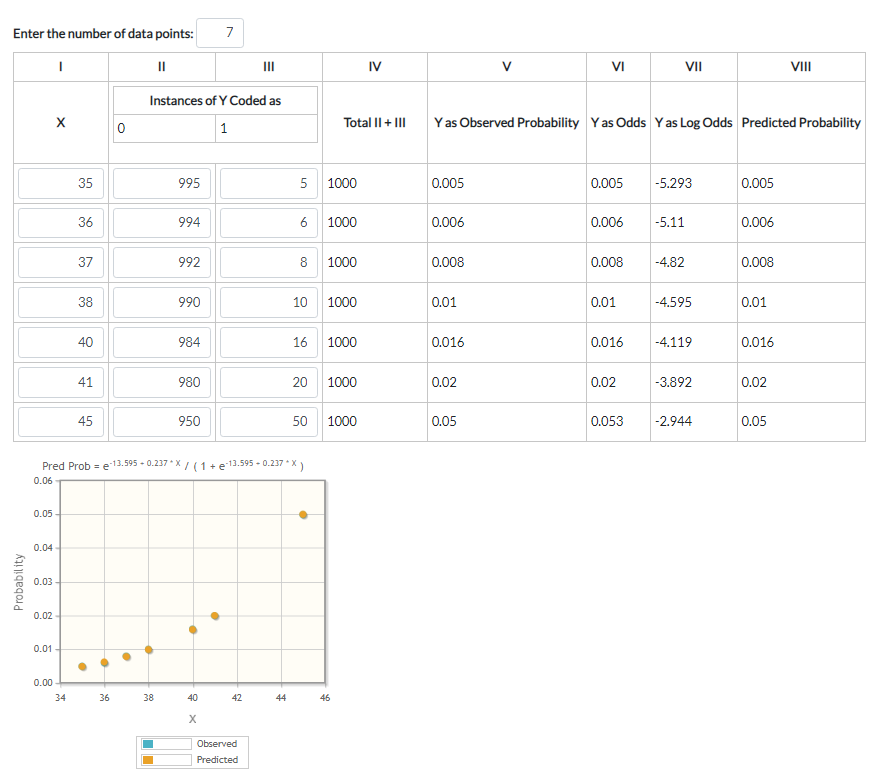
Notice from the graph that our logistic model appears to do a very good job of modelling our actual data. In fact, you can't even see the actual (blue dot) data behind its predicted counterparts (orange dots). But they are there. Also notice that the data is somewhat sparce. We have no probability of birth defects corresponding to women aged 39, for instance. But now we have a logistic equation we can use to help us predict what that probability would be. We just put an age (39) in for X and the model equation will generate the corresponding probability: e-13.595 + 0.237 * (39) / (1 + e-13.595 + 0.237 * (39) ) = 0.013. So, we can say that a woman of age 39 can expect to have a 1.3% chance of having a child with a birth defect.
Enter the number of data points you have below, then the table will show. Then enter your observed Xs, Ys coded as 0 and Ys coded as 1. Your results will automatically be generated.
If you've found a bug, or would like to contact us, or learn more about James Graham and Calculate.co.nz.
Calculate.co.nz is partnered with Interest.co.nz for New Zealand's highest quality calculators and financial analysis.
All calculators and tools are provided for educational and indicative purposes only and do not constitute financial advice.
Calculate.co.nz is proudly part of the Realtor.co.nz group, New Zealand's leading property transaction literacy platform, helping Kiwis understand the home buying and selling process from start to finish. Whether you're a first home buyer navigating your first property purchase, an investor evaluating your next acquisition, or a homeowner planning to sell, Realtor.co.nz provides clear, independent, and trustworthy guidance on every step of the New Zealand property transaction journey.
Calculate.co.nz is also partnered with Health Based Building and Premium Homes to promote informed choices that lead to better long-term outcomes for Kiwi households.
Calculate.co.nz is hosted in Auckland via SiteHost new Zealand.
All content on this website, including calculators, tools, source code, and design, is protected under the Copyright Act 1994 (New Zealand). No part of this site may be reproduced, copied, distributed, stored, or used in any form without prior written permission from the owner.
© 2019 to 2026 Calculate.co.nz. All rights reserved.