The internal rate of return IRR rate is a calculation which is often used by businesses to test the viability of an investment. This IRR calculator allows you to compare multiple scenarios at the same time, which makes comparing the respective cash flow outputs and IRR results easier. The IRR calculator produces a percentage return rate, rather than the monetary return rate as seen in the NPV calculation. If we look at three scenarios in which a small printing business is looking to purchase a new machine to facilitate growth within the local market, we can test scenarios to work out which is the best option for the printing company base on the internal rate of return (IRR) measure.
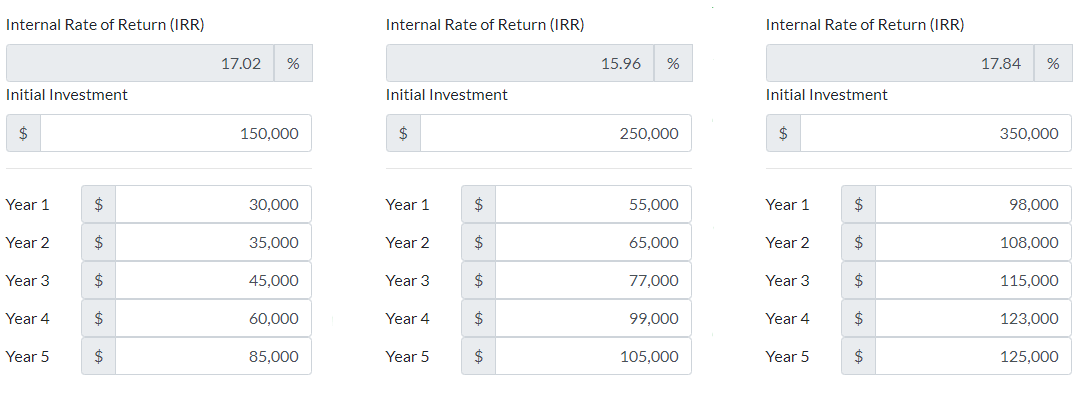
The first machine that we profile is Machine A, which costs $150,000 NZD for the initial investment and has a 5-year working lifespan. In Year 1 the cashflows are $30,000, in Year 2 the cashflows are $35,000, in Year 3the cashflows are $45,000, in Year 4 the cashflows are $60,000 and in Year 5 the cashflows are $85,000. Putting these values into the left-hand calculator below, we can see the IRR (Internal Rate of Return) for Machine A over the 5-year period is 17.02%.
The second machine that we profile is Machine B, which costs $250,000 NZD for the initial investment and has a 5-year working lifespan. In Year 1 the cashflows are $55,000, in Year 2 the cashflows are $65,000, in Year 3 the cashflows are $77,000, in Year 4 the cashflows are $99,000 and in Year 5 the cashflows are $105,000. Putting these values into the middle calculator below we can see the IRR (Internal Rate of Return) for Machine B over the 5-year period is 15.96%.
The third machine that we profile is Machine C, costs $350,000 NZD for the initial investment and has a 5-year working lifespan. In Year 1 the cashflows are $98,000, in Year 2 the cashflows are $108,000, in Year 3 the cashflows are $115,000, in Year 4 the cashflows are $123,000 and in Year 5 the cashflows are $125,000. Putting these values into the right-hand calculator below we can see the IRR (Internal Rate of Return) for Machine C over the 5-year period is 17.84%.
Looking at the results of the three machine comparisons, we can see that the best IRR comes from the investment in Machine C with an IRR of 17.84%, compared to the second best return of 17.02% from Machine A. In this example given that Machine C costs more than double the cost of Machine A depending on the borrowing capacity, or phase of development, the business could argue that Machine A or Machine C was the best fit at that point in time given the marginal difference in the IRR returns, and the potential for borrowing to purchase either machine.
Here is the above example as shown in the calculation tool below.

To use the IRR calculator below, simply choose the number of periods or years you would like to calculate within the 'Years/Periods Required' field, then enter in the cashflow data for each year, for as many scenarios (up to 3) you would like to observe.
Scenario 1
Scenario 2
Scenario 3